深入研究 Kubernetes Garbage Collection:容器镜像清除机制
kubelet 如何触发垃圾收集机制 (Garbage Collection)?在本文中,我们将深入探讨 Kubernetes Garbage Collection,并且理解 kubelet 如何实现镜像清除机制。此外,我们也将探讨如何正确地监控 imageFS 的使用情况。
当 kubelet 检测到 imageFs(存储容器镜像的文件系统)的可用空间低于预定阈值时,它会触发 Garbage Collection,即开始清理不再需要的容器镜像以释放空间。这一阈值可以通过 kubelet 的配置选项 --image-gc-high-threshold (imageGCHighThresholdPercent) 设置,默认值为 85%,这意味着当 imageFs 的可用空间低于总空间的 85% 时,kubelet 将开始进行镜像清理工作,并且可能在日志中注意到类似以下的提示:
kubelet[2298]: I0226 11:59:17.153440    2298 image_gc_manager.go:310] "Disk usage on image filesystem is over the high threshold, trying to free bytes down to the low threshold" usage=93 highThreshold=85 amountToFree=69382155468 lowThreshold=80

kubelet[2298]: I0226 12:04:17.157231    2298 image_gc_manager.go:310] "Disk usage on image filesystem is over the high threshold, trying to free bytes down to the low threshold" usage=97 highThreshold=85 amountToFree=88325110988 lowThreshold=80
kubelet 如何计算容器镜像空间并且触发 Garbage Collection
要了解 kubelet 其中对于容器镜像管理的 Garbage Collection 的机制,就得先分析 kubelet 实际是如何分析磁盘空间,并且根据对应设置参数设置触发清除工作。
以 Kubernetes 1.29 核心代码为例 1。在该片段中,定义了 usagePercent 计算方法,并且提供了一个判断式检查是否超过 im.policy.HighThresholdPercent 的数值。从这个片段中,可以推敲这里的逻辑与上述的参数设置触发镜像清理行为相关:
  // Get disk usage on disk holding images.
  fsStats, _, err := im.statsProvider.ImageFsStats(ctx)
  if err != nil {
    return err
  }

	var capacity, available int64
	if fsStats.CapacityBytes != nil {
		capacity = int64(*fsStats.CapacityBytes)
	}
	if fsStats.AvailableBytes != nil {
		available = int64(*fsStats.AvailableBytes)
	}

  ...

  // If over the max threshold, free enough to place us at the lower threshold.
  usagePercent := 100 - int(available*100/capacity)
  if usagePercent >= im.policy.HighThresholdPercent {
    amountToFree := capacity*int64(100-im.policy.LowThresholdPercent)/100 - available
    klog.InfoS("Disk usage on image filesystem is over the high threshold, trying to free bytes down to the low threshold", "usage", usagePercent, "highThreshold", im.policy.HighThresholdPercent, "amountToFree", amountToFree, "lowThreshold", im.policy.LowThresholdPercent)
    freed, err := im.freeSpace(ctx, amountToFree, freeTime, images)
    if err != nil {
      return err
    }

    if freed < amountToFree {
      err := fmt.Errorf("Failed to garbage collect required amount of images. Attempted to free %d bytes, but only found %d bytes eligible to free.", amountToFree, freed)
      im.recorder.Eventf(im.nodeRef, v1.EventTypeWarning, events.FreeDiskSpaceFailed, err.Error())
      return err
    }
  }
值得一提的是,变量 capacity 以及 available 从字面上来看分别代表了总以及剩余可用空间,实现上实际引用了 statsProvider.ImageFsStats 其中的 CapacityBytes 以及 AvailableBytes 数值。
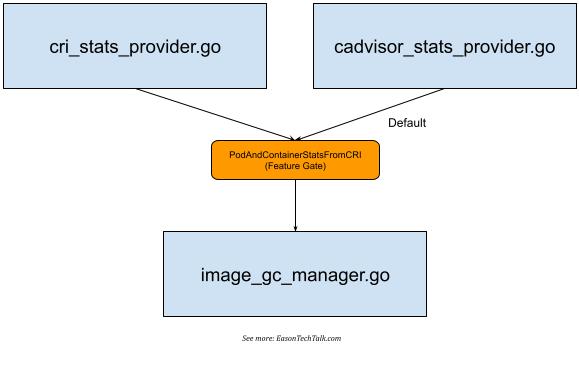
如果进一步分析核心代码,可以发现 statsProvider 可以根据实现上的定义存在获取镜像对应的存储空间数据有些微不同 (Image Filesystem,以下简称 imageFS)。ImageFS 在 kubelet 核心代码中存在两者不同的实现方式,一种为使用 CRI 获取,另一种则为使用 cadvisor,因此,在核心代码目录中可以注意到存在 cri_stats_provider.go 2 以及 cadvisor_stats_provider.go 3 两者不同的实现。
这项机制在 Kubernetes 1.23 版本支持了这项 PodAndContainerStatsFromCRI 测试功能 (Feature Gate 4),允许 kubelet 通过 CRI 接口与 Container runtime 互动获取容器相关的指标和数据,但默认都是关闭 5,并且使用 cadvisor 作为主要的收集来源。
但不论使用哪种方式收集,根据 kubelet 提供的对应数据统计,其统计结果皆可以使用 kubelet 本身提供的 API 获得这项信息,例如:
$ kubectl get --raw /api/v1/nodes/ip-172-31-21-234.eu-west-1.compute.internal/proxy/stats/summary | jq '.node.runtime.imageFs'
{
  "time": "2024-03-11T10:59:56Z",
  "availableBytes": 17310752768,
  "capacityBytes": 21462233088,
  "usedBytes": 1291296768,
  "inodesFree": 10375082,
  "inodes": 10484720,
  "inodesUsed": 44497
}
在使用 containerd 作为容器执行的通用环境下 (例如:Amazon EKS),其默认将使用 /var/lib/containerd 作为主要的 imageFS 位置:
$ head /etc/containerd/config.toml
version = 2
root = "/var/lib/containerd"
state = "/run/containerd"
(如果想了解更多有关 imageFS 的位置,Kubernetes Blog 近期有一篇文章在描述不同 Container runtime 对应的 imageFS 磁盘存储空间耗尽问题,并且建议分离文件系统位置 6,在此不赘述)
如果是 CRI,可以尝试使用 CRI 命令行工具了解 Container Runtime 所使用的 imageFS 挂载位置:
$ sudo crictl imagefsinfo
{
  "status": {
    "imageFilesystems": [
      {
        "timestamp": "1710154476577999227",
        "fsId": {
          "mountpoint": "/var/lib/containerd/io.containerd.snapshotter.v1.overlayfs"
        },
        "usedBytes": {
          "value": "1291296768"
        },
        "inodesUsed": {
          "value": "44497"
        }
      }
    ],
    "containerFilesystems": []
  }
}
因此,我们可以得知 kubelet 会截取 imageFS 中的 capacity, available 等数值 (不论是 CRI 或是 cadvisor),上述设置中也可以得知我环境中 imageFS 对应的存储位置为 /var/lib/containerd (containerd)。这部分意味着容器镜像的空间将可能与系统的挂载位置共用,例如,以下是我的系统空间输出,可以根据以下数据尝试计算取得的数值与 df 得到的数值是否匹配:
$ df
Filesystem     1K-blocks    Used Available Use% Mounted on
devtmpfs         1962632       0   1962632   0% /dev
tmpfs            1971680       0   1971680   0% /dev/shm
tmpfs            1971680    1696   1969984   1% /run
tmpfs            1971680       0   1971680   0% /sys/fs/cgroup
/dev/nvme0n1p1  20959212 4054180  16905032  20% /
shm                65536       0     65536   0% /run/containerd/io.containerd.grpc.v1.cri/sandboxes/6d62590341a08f4066c168f2d00118ac5aade67ceb2797c0d88f97cbe825e302/shm
shm                65536       0     65536   0% /run/containerd/io.containerd.grpc.v1.cri/sandboxes/6f3f7200edfeb3129b765652da98f14009597d26bfcc7973232984ea431e67a7/shm
shm                65536       0     65536   0% /run/containerd/io.containerd.grpc.v1.cri/sandboxes/7c9b3b1b9853dcdccdcc18e99ca89caeac236150df67881dd054651339038efc/shm
shm                65536       0     65536   0% /run/containerd/io.containerd.grpc.v1.cri/sandboxes/38935dde2e2d40d73d039befc1283e165284269f7bb11002fd3937c274998fb5/shm
shm                65536       0     65536   0% /run/containerd/io.containerd.grpc.v1.cri/sandboxes/6fb8c888e2fa36a1ac909909dad4d4f5d520f48eb42731353f176f6e9dd76f03/shm
tmpfs             394336       0    394336   0% /run/user/1000
/var/lib/containerd并未分离不同的文件系统因此共享/的对应空间- 根目录位置的
Available数值为16905032 KiB,该数值与上述 kubelet 获取的imageFs.availableBytes的数值相同 (17310752768)。由于 kubelet 获取的单位是Byte,转换为KiB后为17310752768 (imageFs.availableBytes) / 1024 = 16905032 KiB(约 17 G) - 挂载点
/的总空间大小为1K-block数值 (20959212 KiB),等同于转换后的21462233088 (imageFs.capacityBytes) / 1024 = 20959212 KiB数值 (约 20 G)
在知道 kubelet 是如何获取 imageFS 可用空间和相关数值后,根据 kubelet 核心代码的实现,我们可以知道在上述执行环境中,计算使用空间是否超出 --image-gc-high-threshold 定义的阈值 (默认为 85%) 则可以根据以下结果得知:
# usagePercent := 100 - int(available*100/capacity)
# 约等于 20%
usagePercent = 100 - (17310752768 * 100 / 21462233088)
由于我的环境中 imageFS 与 / 空间共享,因此该数值与 df 提供的百分比近似而可以作为参考值。
因此,在我的例子中这样的状态并不足以触发 Garbage Collection 并且清除部分的容器镜像。更一步则可能根据 Hard Eviction Threshold 的参数 --eviction-hard (驱逐条件) 触发 Pod 驱逐操作将部分的 Pod 停止并且移除,例如 imagefs.available<15% 7。
如何监控 imageFS 的用量
在了解 kubelet 的运作机制和计算方法后,我们可以通过实现一个简单的 Shell Script 来获取每个节点的 imageFS 存储空间和使用率概况,例如:
nodes=$(kubectl get no -o=jsonpath='{.items[*].metadata.name}')

for node in $nodes; do
    imageFS=$(kubectl get --raw "/api/v1/nodes/$node/proxy/stats/summary"  | jq .node.runtime.imageFs)
    available=$(echo $imageFS | jq '.availableBytes')
    capacity=$(echo $imageFS | jq '.capacityBytes')

    usagePercent=$((100 - $available * 100 / $capacity))

    echo "Node: $node, Available: $(($available / 1024 / 1024)) MiB, Capacity: $(($capacity / 1024 / 1024)) MiB, Usage: $usagePercent%"
done
然而,在 imageFS 与主要挂载位置共用的通用情况下,要监控使用空间是否紧张而进一步触发 Garbage Collection,除了上述简单的实现,也可以通过常见的监控完成,例如上述的 df 所见的使用量百分比数据即可作为一项参考,亦或者是监控系统中有引入常见的 Prometheus Node Exporter 的提供了文件系统相关的功能 (例如可以定义 --collector.filesystem.mount-points-exclude 决定哪些挂载点要排除监控) 能够具体将文件系统的数据进一步转数值化,以进行近一步的监控。
总结
本文深入探讨了 Kubernetes 的垃圾收集机制 (Garbage Collection) 以及如何监控 imageFS 的使用情况。在了解 Kubernetes 的 Garbage Collection 以及如何监控 imageFS 的使用情况后,可以对于 Kubernetes 环境的监控和资源使用有更全面的认识。妥善的资源管理能确保系统的稳定与性能,避免因为资源耗尽而导致的非预期服务中断。
参考资料