Deep dive into Kubernetes Garbage Collector: Container Image
How does the kubelet trigger the Garbage Collection mechanism? In this article, we delve into the Kubernetes Garbage Collection and understand how kubelet implements the image cleanup mechanism. Additionally, we will also explore how to monitor imageFS usage accurately.
When the kubelet detects that the available space in imageFs (the filesystem storing container images) falls below a predetermined threshold, it triggers Garbage Collection, i.e., it begins to clear out unneeded container images to free up space. This threshold can be set via the kubelet’s configuration option --image-gc-high-threshold (imageGCHighThresholdPercent), the default value of which is 85%. This means that when the available space in imageFs drops below 85% of the total space, kubelet begins image cleanup work, and one might notice similar prompts in the log like the following:
kubelet[2298]: I0226 11:59:17.153440    2298 image_gc_manager.go:310] "Disk usage on image filesystem is over the high threshold, trying to free bytes down to the low threshold" usage=93 highThreshold=85 amountToFree=69382155468 lowThreshold=80

kubelet[2298]: I0226 12:04:17.157231    2298 image_gc_manager.go:310] "Disk usage on image filesystem is over the high threshold, trying to free bytes down to the low threshold" usage=97 highThreshold=85 amountToFree=88325110988 lowThreshold=80
How kubelet Calculates Container Image Space and Triggers Garbage Collection
To understand the Garbage Collection mechanism of kubelet for managing container images, we first need to analyze how kubelet calculates disk space and sets corresponding configuration parameters to trigger cleanup tasks.
Taking the core code of Kubernetes 1.29 as an example 1. In this section, the usagePercent calculation method is defined, and a condition is provided to check whether it exceeds the value of im.policy.HighThresholdPercent. From this snippet, we can deduce that the logic here is related to triggering image cleanup behavior according to the aforementioned parameter settings:
  // Get disk usage on disk holding images.
  fsStats, _, err := im.statsProvider.ImageFsStats(ctx)
  if err != nil {
    return err
  }

	var capacity, available int64
	if fsStats.CapacityBytes != nil {
		capacity = int64(*fsStats.CapacityBytes)
	}
	if fsStats.AvailableBytes != nil {
		available = int64(*fsStats.AvailableBytes)
	}

  ...

  // If over the max threshold, free enough to place us at the lower threshold.
  usagePercent := 100 - int(available*100/capacity)
  if usagePercent >= im.policy.HighThresholdPercent {
    amountToFree := capacity*int64(100-im.policy.LowThresholdPercent)/100 - available
    klog.InfoS("Disk usage on image filesystem is over the high threshold, trying to free bytes down to the low threshold", "usage", usagePercent, "highThreshold", im.policy.HighThresholdPercent, "amountToFree", amountToFree, "lowThreshold", im.policy.LowThresholdPercent)
    freed, err := im.freeSpace(ctx, amountToFree, freeTime, images)
    if err != nil {
      return err
    }

    if freed < amountToFree {
      err := fmt.Errorf("Failed to garbage collect required amount of images. Attempted to free %d bytes, but only found %d bytes eligible to free.", amountToFree, freed)
      im.recorder.Eventf(im.nodeRef, v1.EventTypeWarning, events.FreeDiskSpaceFailed, err.Error())
      return err
    }
  }
Worth mentioning is that the variables capacity and available represent the total and remaining available space respectively, and in practice, they actually refer to the CapacityBytes and AvailableBytes values of statsProvider.ImageFsStats.
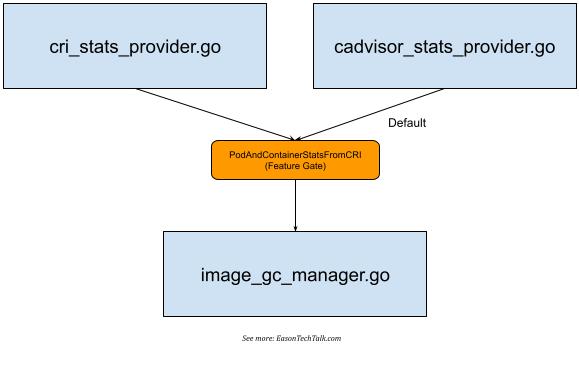
If we further analyze the core code, we can find that statsProvider can have slightly different data for fetching the storage space corresponding to the image depending on the implementation (Image Filesystem, hereinafter referred to as imageFS). There are two different implementations of ImageFS in the kubelet core code, one using CRI to fetch and the other using cadvisor. Therefore, in the core code directory, you can notice the existence of two different implementations, cri_stats_provider.go 2 and cadvisor_stats_provider.go 3.
This mechanism is supported in Kubernetes 1.23 version with the PodAndContainerStatsFromCRI feature gate 4, which allows kubelet to interact with the Container runtime through the CRI interface to obtain container-related metrics and data, but it is turned off by default 5 and uses cadvisor as the main collection source.
Regardless of the collection method used, corresponding data statistics provided by kubelet can be retrieved using the API provided by kubelet itself, as shown below:
$ kubectl get --raw /api/v1/nodes/ip-172-31-21-234.eu-west-1.compute.internal/proxy/stats/summary | jq '.node.runtime.imageFs'
{
  "time": "2024-03-11T10:59:56Z",
  "availableBytes": 17310752768,
  "capacityBytes": 21462233088,
  "usedBytes": 1291296768,
  "inodesFree": 10375082,
  "inodes": 10484720,
  "inodesUsed": 44497
}
When using containerd as the common container runtime environment (such as Amazon EKS), it defaults to using /var/lib/containerd as the primary location for imageFS:
$ head /etc/containerd/config.toml
version = 2
root = "/var/lib/containerd"
state = "/run/containerd"
(For more details about the location of imageFS, a recent article on the Kubernetes Blog describes the problem of disk storage exhaustion for different Container runtimes corresponding to imageFS, and suggests separating file system locations 6, but we won’t go into details here)
If it’s a CRI, you can try using the CRI command-line tool to understand the imageFS mount location used by Container Runtime:
$ sudo crictl imagefsinfo
{
  "status": {
    "imageFilesystems": [
      {
        "timestamp": "1710154476577999227",
        "fsId": {
          "mountpoint": "/var/lib/containerd/io.containerd.snapshotter.v1.overlayfs"
        },
        "usedBytes": {
          "value": "1291296768"
        },
        "inodesUsed": {
          "value": "44497"
        }
      }
    ],
    "containerFilesystems": []
  }
}
Therefore, we can infer that kubelet fetches the capacity and available values from imageFS (whether it’s CRI or cadvisor), and from the above settings, we can also deduce that in my environment, the storage location corresponding to imageFS is /var/lib/containerd (containerd). This implies that the space for container images may be shared with the system’s mount location. For instance, the following is the output of my system space, you can try to calculate the obtained value and see if it matches with the value obtained from df:
$ df
Filesystem     1K-blocks    Used Available Use% Mounted on
devtmpfs         1962632       0   1962632   0% /dev
tmpfs            1971680       0   1971680   0% /dev/shm
tmpfs            1971680    1696   1969984   1% /run
tmpfs            1971680       0   1971680   0% /sys/fs/cgroup
/dev/nvme0n1p1  20959212 4054180  16905032  20% /
shm                65536       0     65536   0% /run/containerd/io.containerd.grpc.v1.cri/sandboxes/6d62590341a08f4066c168f2d00118ac5aade67ceb2797c0d88f97cbe825e302/shm
shm                65536       0     65536   0% /run/containerd/io.containerd.grpc.v1.cri/sandboxes/6f3f7200edfeb3129b765652da98f14009597d26bfcc7973232984ea431e67a7/shm
shm                65536       0     65536   0% /run/containerd/io.containerd.grpc.v1.cri/sandboxes/7c9b3b1b9853dcdccdcc18e99ca89caeac236150df67881dd054651339038efc/shm
shm                65536       0     65536   0% /run/containerd/io.containerd.grpc.v1.cri/sandboxes/38935dde2e2d40d73d039befc1283e165284269f7bb11002fd3937c274998fb5/shm
shm                65536       0     65536   0% /run/containerd/io.containerd.grpc.v1.cri/sandboxes/6fb8c888e2fa36a1ac909909dad4d4f5d520f48eb42731353f176f6e9dd76f03/shm
tmpfs             394336       0    394336   0% /run/user/1000
/var/lib/containerddoes not separate different file systems, so it shares the corresponding space of/- The
Availablevalue of the root directory position is16905032 KiB, which is the same as the value ofimageFs.availableBytesobtained by kubelet (17310752768). Since the unit obtained by kubelet isByte, it is17310752768 (imageFs.availableBytes) / 1024 = 16905032 KiB(approximately 17 G) after conversion toKiB - The total space size of the mount point
/is1K-blockvalue (20959212 KiB), which is equivalent to the converted21462233088 (imageFs.capacityBytes) / 1024 = 20959212 KiBvalue (approximately 20 G)
After knowing how kubelet obtains the available space and relevant values of imageFS and according to the implementation of kubelet’s core code, we know that in the above execution environment, whether the space usage exceeds the threshold defined by --image-gc-high-threshold (default is 85%) can be known from the following result:
# usagePercent := 100 - int(available*100/capacity)
# approximately equals 20%
usagePercent = 100 - (17310752768 * 100 / 21462233088)
Since the imageFS in my environment shares space with /, this value is close to the percentage provided by df and can be used as a reference value.
Therefore, in my example, this status is not enough to trigger Garbage Collection and clear some container images. A further step may trigger Pod eviction operations to stop and remove some Pods based on the parameter --eviction-hard (eviction conditions) of Hard Eviction Threshold, such as imagefs.available<15% 7.
How to Monitor imageFS Usage
After understanding the operation mechanism and calculation method of kubelet, we can implement a simple Shell Script to obtain the storage space and usage rate overview of imageFS for each node, for example:
nodes=$(kubectl get no -o=jsonpath='{.items[*].metadata.name}')

for node in $nodes; do
    imageFS=$(kubectl get --raw "/api/v1/nodes/$node/proxy/stats/summary"  | jq .node.runtime.imageFs)
    available=$(echo $imageFS | jq '.availableBytes')
    capacity=$(echo $imageFS | jq '.capacityBytes')

    usagePercent=$((100 - $available * 100 / $capacity))

    echo "Node: $node, Available: $(($available / 1024 / 1024)) MiB, Capacity: $(($capacity / 1024 / 1024)) MiB, Usage: $usagePercent%"
done
However, in the general situation where imageFS and the main mounting position are shared, to monitor whether the usage space is tight and further trigger Garbage Collection, in addition to the simple implementation above, it can also be completed through common monitoring, for example, the usage percentage data seen in the above df can be used as a reference. Alternatively, if a common tool like Prometheus Node Exporter has been introduced into the monitoring system that provides related filesystem functions (for example, you can define --collector.filesystem.mount-points-exclude to decide which mount points to exclude from monitoring), it can specifically convert filesystem data into numerical form for further monitoring.
Conclusion
This article deeply explored the Garbage Collection mechanism of Kubernetes and how to monitor the usage of imageFS. After understanding the Garbage Collection of Kubernetes and how to monitor the usage of imageFS, we can have a more comprehensive understanding of the monitoring and resource usage of the Kubernetes environment. Proper resource management can ensure the stability and performance of the system and avoid unexpected service interruptions due to resource exhaustion.
References