Utilize EKS Cluster Health Status to monitor your cluster
As an AWS user, it is crucial to monitor the health status of your Elastic Kubernetes Service (EKS) cluster to ensure its stability and performance. By keeping a close eye on your cluster’s health issue report, you can proactively address any issues and maintain the overall health of your Kubernetes cluster. In the past, there’s no such way to let you understand what things could potentially break your EKS cluster until you hit some issue (e.g. Unable to upgrade the cluster). But recently Amazon EKS introduced a small change of cluster-related health details in the EKS console and API, providing administrators enhanced visibility into the health of their clusters.
What’s the change?
On December 28, 2023, Amazon EKS announced now it surfaces cluster health status details.1
The cluster health status information helps customers to quickly diagnose, troubleshoot, and remedy issues with their clusters, enabling them to run more up-to-date and secure application environments.
Because the underlying infrastructure or configuration issues may lead to impaired EKS clusters and prevent EKS from applying updates or upgrading to newer Kubernetes versions. EKS users have responsible for configuring cluster infrastructure such as IAM roles and EC2 subnets. This change reduces the time administrators need to spend troubleshooting infrastructure health issues, making it easier to run secure Kubernetes environments.
In this blog post, we will discuss what’s new and how you can utilize the EKS cluster health status to monitor your EKS cluster effectively.
Monitoring the Health Status of your EKS Cluster
Benefits of Monitoring EKS Cluster Health Status
Monitoring the health status of your EKS cluster offers several benefits. It allows you to stay informed about the overall health and performance of your cluster. By receiving real-time notifications, you can quickly identify any issues or potential problems and take immediate action to resolve them. This proactive approach helps prevent downtime and ensures the smooth functioning of your EKS cluster.
DescribeCluster API Call
The first method to monitor the health status of your EKS cluster is by utilizing the DescribeCluster API call. This API call adds new field to retrieve detailed information about your cluster, including its current status, several different error code2, and any ongoing issues. By making use of this API call, you can gain insights into the health and performance of your cluster.
$ aws eks describe-cluster --name eks --region eu-west-1
{
    "cluster": {
        "name": "eks",
        "arn": "arn:aws:eks:eu-west-1:11222334455:cluster/eks",
        "createdAt": "2024-01-23T20:51:44.751000+00:00",
        "version": "1.27",
    }
    "health": {
            "issues": []
        }
    }
}
By leveraging either the DescribeCluster API call or the EKS Console, you can stay informed about the health status of your EKS cluster. This enables you to take immediate action in case of any issues or potential problems, ensuring the smooth operation of your applications.
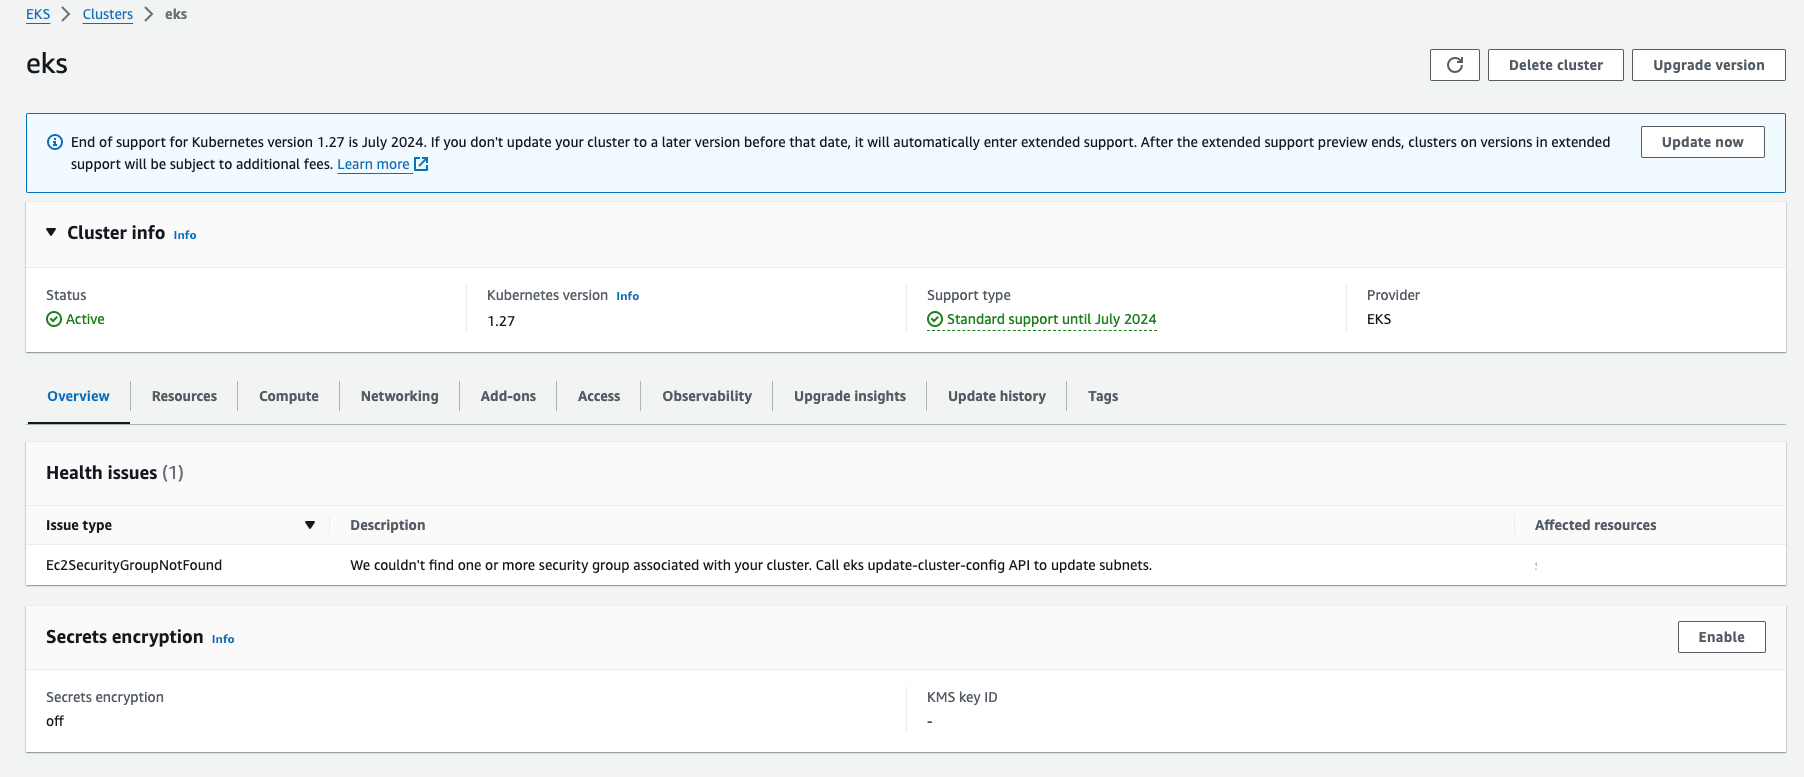
EKS Console
You can also monitor the health status of your EKS cluster is through the EKS Console. The EKS Console adds new section to provide the health status of your cluster. With the EKS Console, you can easily navigate through different sections and obtain real-time information about your cluster’s health.
Integrate Slack notification for Monitoring
Currently, the EKS Cluster doesn’t onboard proactive notification or CloudWatch event, which means you need to check the status by calling API manually. To set up monitoring for your EKS cluster health status and receive notification, you can consider integrating EventBridge with your cluster. EventBridge is a serverless event bus service provided by AWS, which allows you to route events between different AWS services and external applications, or even set up schedule event to trigger action. By configuring EventBridge to trigger a Lambda function and monitor the DescribeCluster API call, you can receive real-time notifications whenever there are changes or updates to your cluster’s health status.
Below is the simple solution I have implemented:
Solution overview
- Create a Lambda function (MoninitorEKSClusterHealth) and utilize the
DescribeClusterAPI call - Associate Slack Channel with AWS Bot and create a SNS topic for notification
- Use EventBridge Scheduler to schedule cron job for invoking the Lambda function (MoninitorEKSClusterHealth) regularly. If the cluster has health issue, it throw the error in the execution.
- Create CloudWatch alarm to monitor Lambda function (MoninitorEKSClusterHealth) error and trigger SNS for real-time Slack notifications
Create a Lambda function
The first step is to have Lambda function can help us interpret the cluster health status and capture any error, below is an example by using Python:
import json
import boto3

def describe_eks_cluster(cluster_name):
    eks_client = boto3.client('eks')
    response = eks_client.describe_cluster(name=cluster_name)
    health_issues = response['cluster']['health']['issues']

    if len(health_issues) > 0:
        raise Exception("Cluster has health issues: {0}".format(health_issues))

    return response

def lambda_handler(event, context):
    cluster_name = event['eks-cluster-name']
    cluster_info = ''

    cluster_info = describe_eks_cluster(cluster_name)
    print(cluster_info)

    return {
        'statusCode': 200,
        'body': 'success'
    }
When there’s a cluster health issue, the API will response the details in the health issue field. For example, below is an error that captured from CloudWatch Log group of my MoninitorEKSClusterHealth function. **It indicates that there is an exception in the code related to a cluster’s health issues. The specific error is Ec2SecurityGroupNotFound which means that one or more security groups associated with the cluster could not be found.
[ERROR] Exception: Cluster has health issues:

['code': 'Ec2SecurityGroupNotFound',
 'message': "We couldn't find one or more security group associated with your cluster. Call eks update-cluster-config API to update subnets.",
 'resourceIds': ['sg-XXXXXXX']
Traceback (most recent call last):
File "/var/task/Lambda_function.py", line 18, in lambda_handler
cluster_info = describe_ eks_cluster(cluster_name)
File "/var/task/lambda_function.py", line 10, in describe_eks_cluster raise Exception("Cluster has health issues: {01" format(health_issues))
The exception throwing for existing health issue by the python code is the key, as it can generate an error for CloudWatch metric of AWS Lambda, which can be monitored by creating an CloudWatch alarm.
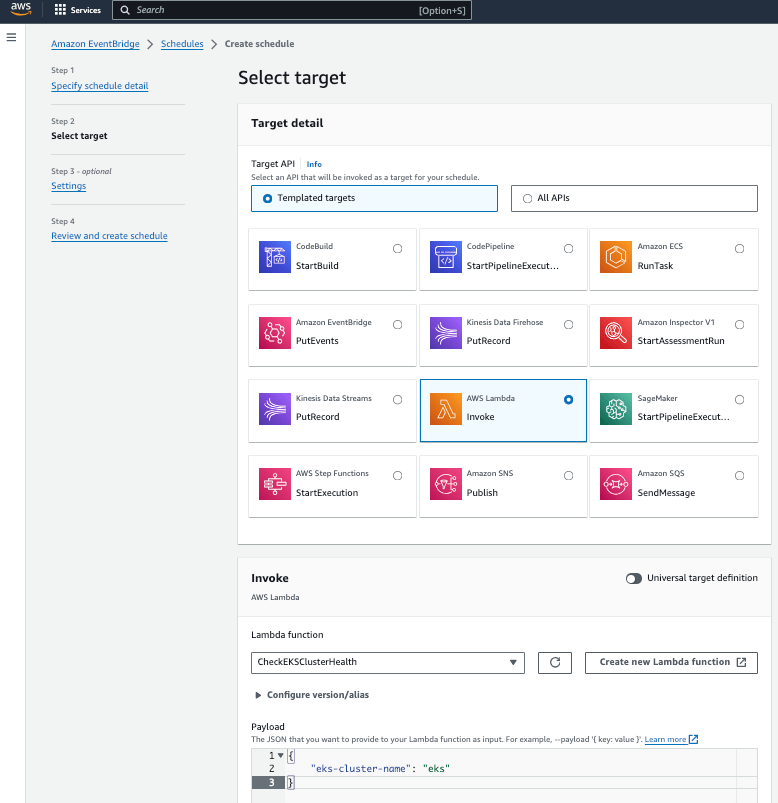
Create a schedule in AWS EventBridge Scheuler
The next step in monitoring the health status of your EKS cluster is to create a schedule in AWS EventBridge Scheduler. In my environment I pass the parameter eks-cluster-name to let the scheduled job knowing which cluster I want to check when invoking my function. By configuring a cron job to regularly invoke the Lambda function, you can ensure that the health status of your cluster is checked at specified intervals.
Set up an CloudWatch Alarm
Once we have a Lambda function to report the cluster health and will be triggered regularly, we can set up an CloudWatch Alarm and only monitor this Lambda function to capture error. In my case I simply set up an alarm to monitor Erros metric under AWS/Lambda namespace for my function (MoninitorEKSClusterHealth):
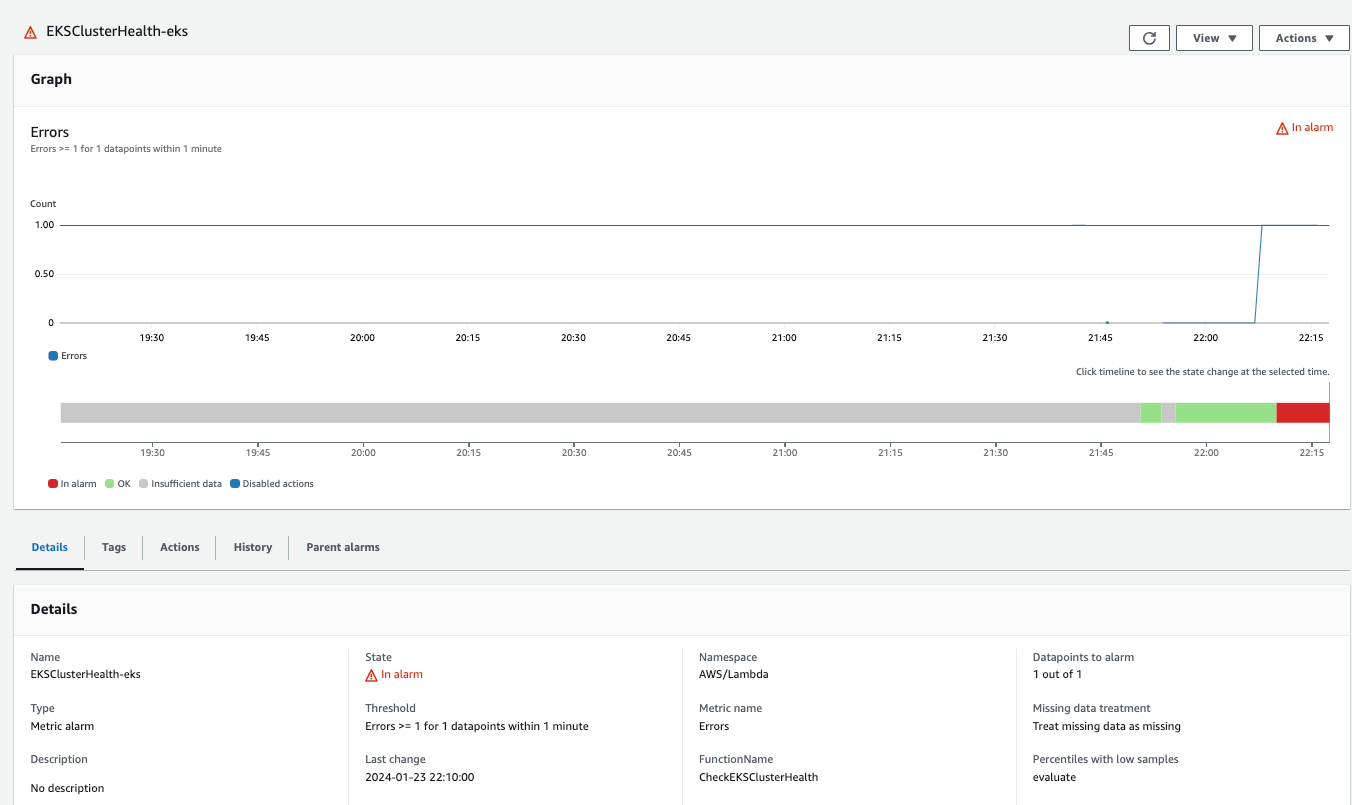
In case the cluster has any health issues, the Lambda function will throw an error during execution, and CloudWatch alarm will flip to In alarm state, triggering real-time Slack notifications via CloudWatch alarms and SNS topics. In my account, I already have AWS Bot (Slack chatbot) configured and subscribed it a SNS topic3. This allows me can stay updated and take immediate action to resolve any problems with my EKS cluster.
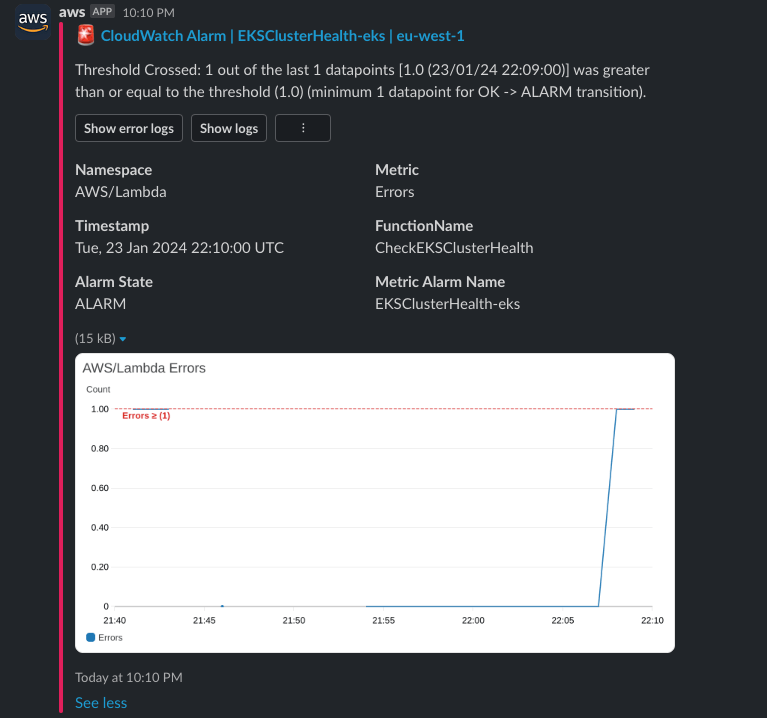
The AWS Chatbot also provides capability to view the error logs of the Lambda function, this could be very useful and easily access more information to understand why the cluster is having health issue:
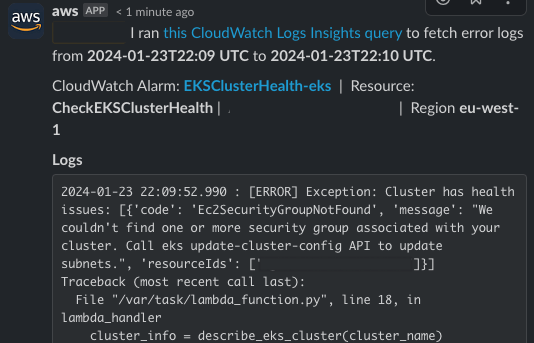
Conclusion
In conclusion, monitoring the health status of your EKS cluster is crucial for maintaining its stability, performance, and security. By utilizing the DescribeCluster API call or the EKS Console, you can stay informed about the health status of your cluster and take prompt action when needed. Additionally, integrating EventBridge can enhance your monitoring capabilities and provide real-time notifications. This post walk through the feature by utilizing the DescribeCluster API call and share how to receive real-time notifications about your cluster’s health status and take immediate action when needed.
Start monitoring your EKS cluster’s health status today to ensure the optimal functioning of your applications.
Reference