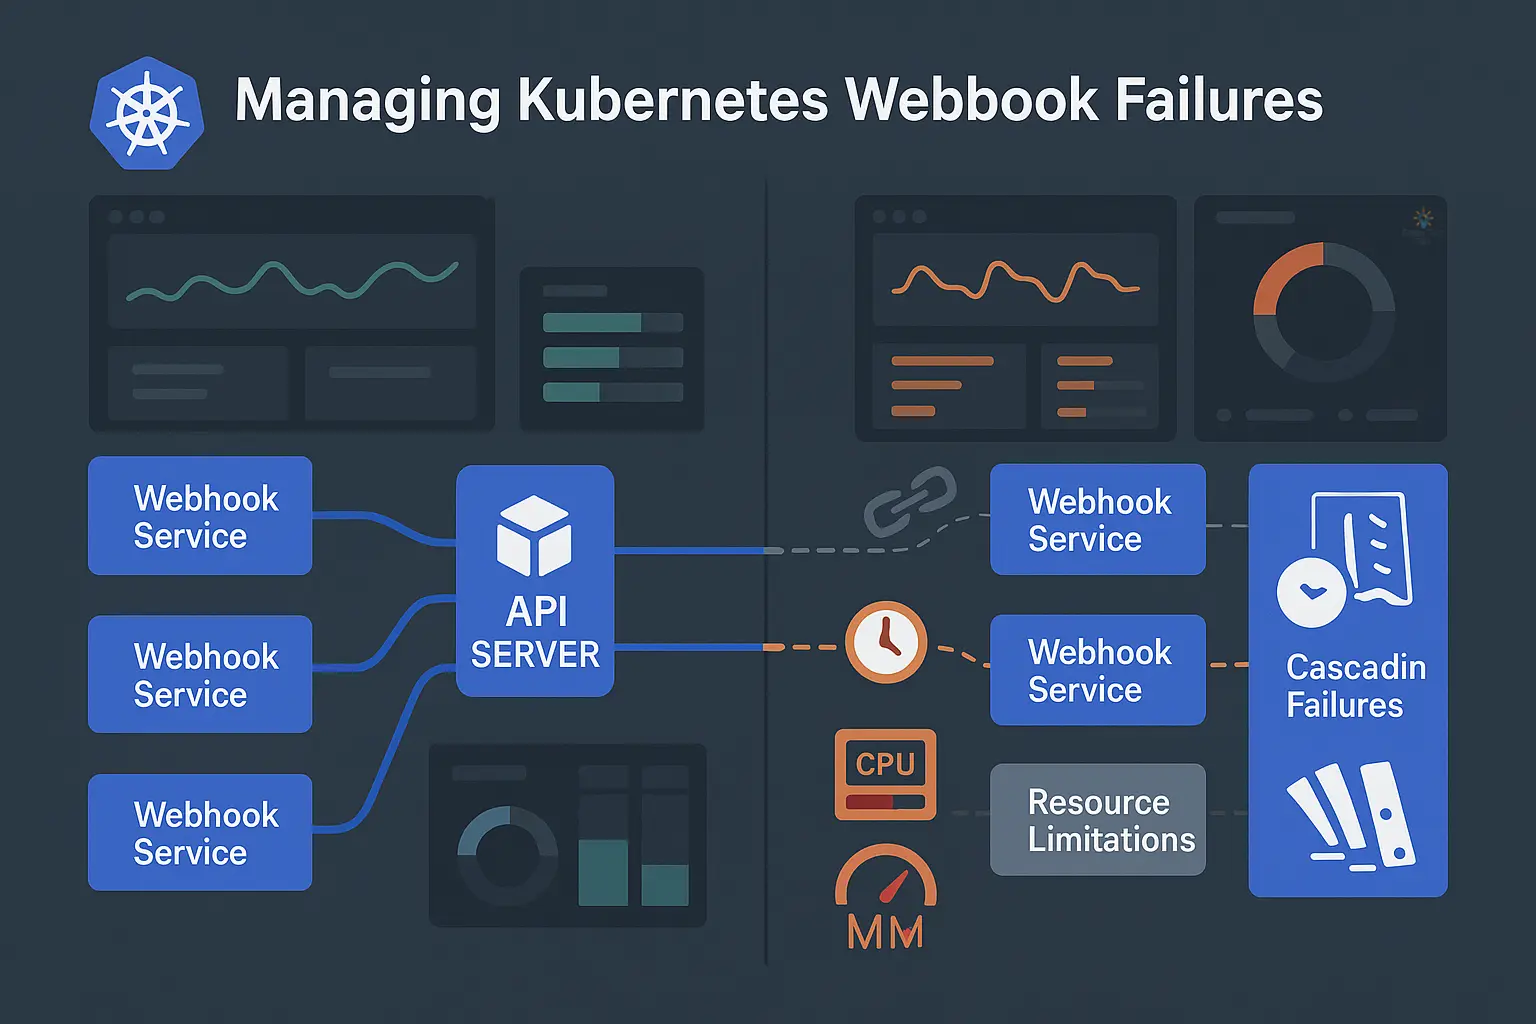
Managing Kubernetes Webhook Failures: From Diagnosis to Solutions
In modern cloud-native architectures, Kubernetes Admission Webhooks play a crucial role, allowing us to extend and customize Kubernetes behavior without modifying the core code. However, this powerful functionality also introduces potential risks — when webhooks fail, they can severely impact the entire cluster and even cause systemic service disruptions.
As a practitioner in the container technology field, I have assisted in handling multiple production incidents caused by webhook failures. These experiences have given me a deep understanding that knowing webhook operation mechanisms, mastering failure diagnosis techniques, and implementing appropriate monitoring strategies are essential for maintaining Kubernetes cluster stability. Therefore, this article focuses on sharing a comprehensive guide from diagnosis to solutions, including real case studies and preventive measures. Through this content, I hope to help more Kubernetes administrators quickly identify root causes and implement appropriate solutions when facing webhook-related issues.
This content is also summarized and shared in the Kubernetes Community Day (KCD) Taipei 2025 presentation 1.
Kubernetes Admission Webhook Overview
Kubernetes Admission Control is a mechanism in Kubernetes that allows intercepting and modifying API requests before resources are stored in etcd. Kubernetes Admission Webhooks are part of the dynamic extension mechanism, allowing developers to customize and extend Kubernetes control logic. This mechanism uses HTTP callbacks to enable external services to participate in resource management decisions, validating or modifying resources before they are persisted to etcd.
Kubernetes provides many built-in Admission plugins that can be enabled through the Kubernetes API Server’s --enable-admission-plugins parameter, for example:
kube-apiserver --enable-admission-plugins=NamespaceLifecycle,LimitRanger...
For instance, at the time of writing, the latest version is Kubernetes 1.33, which enables the following Admission plugins by default:
CertificateApprovalCertificateSigningCertificateSubjectRestrictionDefaultIngressClassDefaultStorageClassDefaultTolerationSecondsLimitRangerMutatingAdmissionWebhookNamespaceLifecyclePersistentVolumeClaimResizePodSecurityPriorityResourceQuotaRuntimeClassServiceAccountStorageObjectInUseProtectionTaintNodesByConditionValidatingAdmissionPolicyValidatingAdmissionWebhook
To extend Kubernetes functionality, additional MutatingAdmissionWebhook and ValidatingAdmissionWebhook are key mechanisms for dynamically extending the Kubernetes API. They can intercept requests during the resource processing by the Kubernetes API Server and execute additional logic, such as validating whether resource specifications comply with organizational policies or automatically modifying resource configurations to meet specific requirements.
In practical applications, Admission Webhooks are widely used in multiple scenarios:
- Image security scanning: Ensuring only security-scanned container images can be deployed to the cluster
- Namespace management: Automatically adding specific labels or annotations to resources
- Sidecar injection: Automatically injecting monitoring and log collection sidecar containers
Many open-source projects rely on webhooks to provide functionality, such as Istio (for sidecar injection), Cert-manager (automated certificate management), Kyverno and Gatekeeper (policy control), etc.
Suppose you need to automatically add corresponding annotations based on Pod labels. For example, when a Pod has the label app=nginx, you need to automatically add an annotation called foo with the value stack. But if the app label value is mongo, the annotation value should be different. This essentially requires a lookup table to map X values to Y values, which is usually not easy to implement. Using Kyverno, you can not only replace these custom annotation tools but also use native Kubernetes resources like ConfigMap to define this mapping table and dynamically apply corresponding values. This dynamic operation involves the Kubernetes Admission Webhook mechanism. Here’s a Kyverno rule example that can dynamically add annotations based on Pod labels:
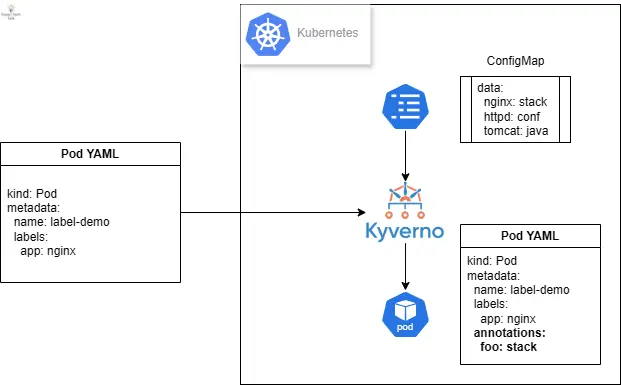
First, we need a ConfigMap as a reference table. This is a standard ConfigMap where each key has a corresponding value, forming a mapping relationship between labels and annotations.
apiVersion: v1
kind: ConfigMap
metadata:
  name: resource-annotater-reference
  namespace: default
data:
  httpd: conf
  nginx: stack
  tomcat: java
Next, we need a policy containing the modification logic. Here’s an example that does several things. First, it uses what Kyverno calls context to provide a reference to an existing ConfigMap. Second, it uses JMESPath expressions to perform the reference and insert the annotation value named foo.
apiVersion: kyverno.io/v1
kind: ClusterPolicy
metadata:
name: resource-annotater
spec:
background: false
rules:
  - name: add-resource-annotations
    context:
    - name: LabelsCM
      configMap:
        name: resource-annotater-reference
        namespace: default
    preconditions:
    - key: "{{request.object.metadata.labels.app}}"
      operator: NotEquals
      value: ""
    - key: "{{request.operation}}"
      operator: Equals
      value: "CREATE"
    match:
      resources:
        kinds:
        - Pod
    mutate:
      overlay:
        metadata:
          annotations:
            foo: "{{LabelsCM.data.{{ request.object.metadata.labels.app }}}}"
Finally, let’s test with a simple Pod definition. In this definition, the input is a label named app with the value nginx.
apiVersion: v1
kind: Pod
metadata:
  labels:
    app: nginx
  name: mypod
spec:
  automountServiceAccountToken: false
  containers:
  - name: busybox
    image: busybox:1.28
    args:
    - "sleep"
    - "9999"
After creating this resource, checking the Pod annotations will show that Kyverno has written the corresponding value found in the ConfigMap based on the incoming app label value.
$ kubectl get po mypod -o jsonpath='{.metadata.annotations}' | jq
{
  "foo": "stack",
  "policies.kyverno.io/patches": "add-resource-annotations.resource-annotater.kyverno.io: removed /metadata/creationTimestamp\n"
}
Kubernetes Admission Webhook Workflow
After understanding the basic concepts of Kubernetes Admission Webhooks, let’s look at the webhook workflow. In a typical API request processing flow, when users or system components send requests to the Kubernetes API Server, the request goes through a series of processing steps. First, the request passes through Authentication and Authorization checks to ensure the requester has permission to perform the operation. Then, the request enters the Admission Control phase, which includes processing by Mutating Webhooks and Validating Webhooks.
Admission Webhooks are mainly divided into two types:
- Validating Webhooks: Responsible for validating whether resource requests comply with specific rules, can accept or reject requests, but cannot modify request content.
- Mutating Webhooks: In addition to validating requests, they can also modify request content, such as adding default values or injecting additional configurations.
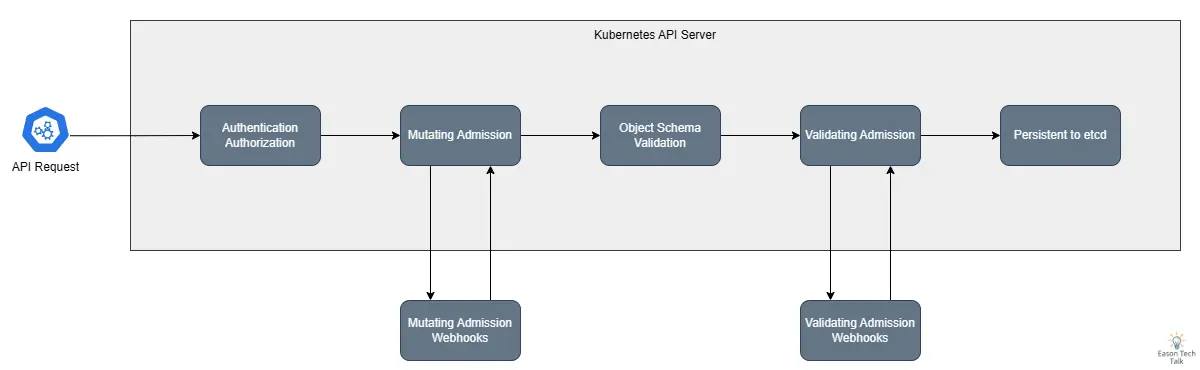
In the API server’s request processing flow, when a request arrives, it first undergoes authentication and authorization checks, then sequentially passes through all registered Mutating Webhooks. These webhooks can modify the request, such as adding labels, annotations, or injecting sidecar containers. After modifications are complete, the request enters the Validating Webhook phase, where webhooks can only validate whether the request complies with specific rules but cannot make any modifications. Finally, if all webhooks pass, the request is permanently stored in etcd.
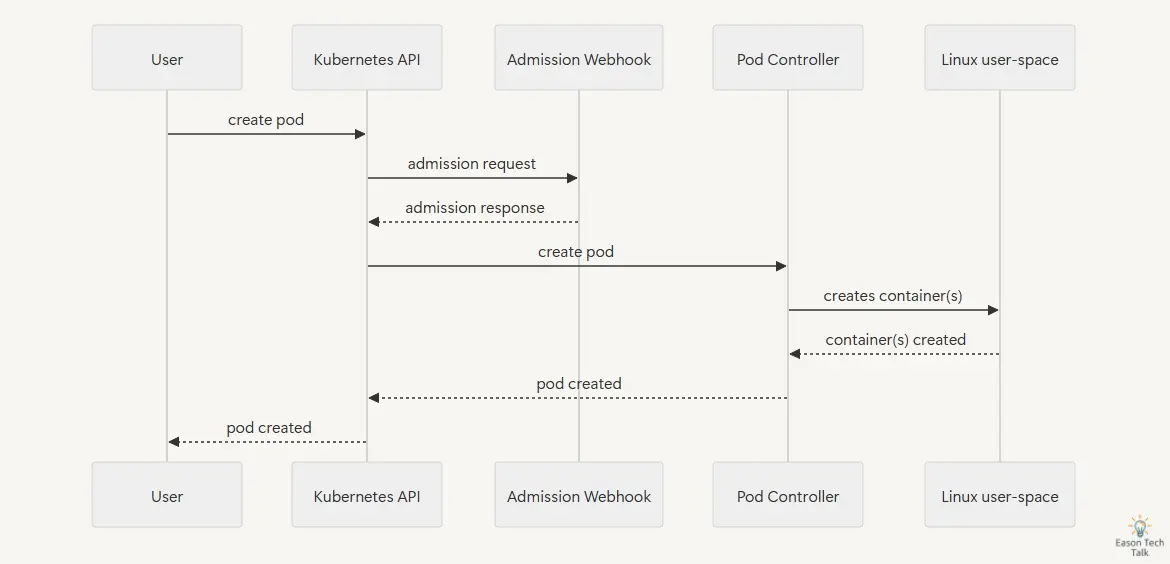
Behind this, the API Server will actively call and trigger corresponding webhook services. For example, when a user attempts to create a Pod resource, the API Server will request the webhook service for validation or modification. After receiving the request, the webhook service processes it according to predetermined logic and returns the result to the API Server. The API Server decides whether to continue processing the request or return an error to the user based on the webhook’s response. This request-response cycle forms the basic workflow of webhooks.
The webhook service application needs to return an AdmissionReview type response (200 HTTP status code) with data structure Content-Type: application/json. This response tells the API Server whether the request is allowed or rejected, and any necessary modification content. Here are two typical AdmissionReview response examples, representing accepting and rejecting requests respectively.
Webhook response example for accepting requests:
{
  "apiVersion": "admission.k8s.io/v1",
  "kind": "AdmissionReview",
  "response": {
    "uid": "<value from request.uid>",
    "allowed": true
  }
}
Minimal webhook response example for rejecting requests (Validating webhook):
{
 "kind": "AdmissionReview",
 "apiVersion": "admission.k8s.io/v1",
 "response": {
   "uid": "9e8992f7-5761-4a27-a7b0-501b0d61c7f6",
   "allowed": false,
   "status": {
     "message": "pod name contains \"offensive\"",
     "code": 403
   }
 }
}
How does the Kubernetes API Server specifically know which webhook to trigger when executing specific API operations? This is where MutatingWebhookConfiguration and ValidatingWebhookConfiguration resource definitions come into play. These two types of configurations tell the API Server which webhook services should be triggered under what circumstances. These configuration resources contain important information such as webhook URLs, validation options, matching rules, and error handling policies.
The following shows a basic validating webhook that will:
- Monitor all Pod creation operations
- Send requests to the webhook service (webhook-service) through the specified service
- If the webhook service fails, decide whether to allow the request to pass based on the failurePolicy
apiVersion: admissionregistration.k8s.io/v1
kind: ValidatingWebhookConfiguration
metadata:
  name: pod-policy.example.com
webhooks:
  - name: pod-policy.example.com
    rules:
      - apiGroups: [""]
        apiVersions: ["v1"]
        operations: ["CREATE"]
        resources: ["pods"]
    clientConfig:
      service:
        name: webhook-service
        namespace: default
        path: "/validate"
    failurePolicy: Fail
Custom Mutating webhook configuration is also very similar. Here’s an example using AWS Load Balancer Controller to implement automatic injection of Pod readinessGates functionality:
$ kubectl describe MutatingWebhookConfiguration/aws-load-balancer-webhook
Name:         aws-load-balancer-webhook
Namespace:
Labels:       app.kubernetes.io/instance=aws-load-balancer-controller
              app.kubernetes.io/name=aws-load-balancer-controller
              app.kubernetes.io/version=v2.7.2
API Version:  admissionregistration.k8s.io/v1
Kind:         MutatingWebhookConfiguration
Webhooks:
  Admission Review Versions:
    v1beta1
  Client Config:
    Service:
      Name:        aws-load-balancer-webhook-service
      Namespace:   kube-system
      Path:        /mutate-v1-pod
      Port:        443
  Failure Policy:  Fail
  Match Policy:    Equivalent
  Name:            mpod.elbv2.k8s.aws
  Namespace Selector:
    Match Expressions:
      Key:       elbv2.k8s.aws/pod-readiness-gate-inject
      Operator:  In
      Values:
        enabled
  Object Selector:
    Match Expressions:
      Key:       app.kubernetes.io/name
      Operator:  NotIn
      Values:
        aws-load-balancer-controller
  Rules:
    API Versions:
      v1
    Operations:
      CREATE
    Resources:
      pods
  ...
This AWS Load Balancer Controller MutatingWebhookConfiguration demonstrates several key configuration items:
- Client Config: Defines how the API Server communicates with the webhook service:
- Points to
aws-load-balancer-webhook-servicein thekube-systemnamespace - Uses the
/mutate-v1-podpath to handle Pod modifications - Communicates securely through port 443
- Points to
- Failure Policy: Set to
Fail, meaning the API Server will reject requests when the webhook doesn’t respond. This is an important security measure but may block resource creation during failures. - Namespace Selector: Only processes resources in namespaces with the label
elbv2.k8s.aws/pod-readiness-gate-inject: enabled. This provides fine-grained control, allowing administrators to choose namespaces that need this functionality. - Object Selector: Excludes resources with the label
app.kubernetes.io/name: aws-load-balancer-controller, avoiding webhook processing of the AWS Load Balancer Controller itself, preventing circular dependency issues. - Rules Definition: Specifies only processing Pod resource creation (
CREATE) operations, further limiting its scope.
This configuration clearly defines the webhook’s behavioral boundaries, ensuring it only takes effect where needed (new Pods in namespaces with specific labels).
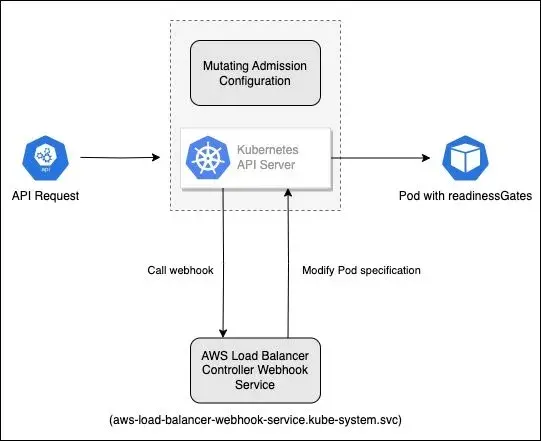
Here’s the specific API request flow triggered by the API Server and modifying Pod specifications:
- User creates a namespace labeled with
elbv2.k8s.aws/pod-readiness-gate-inject: enabled - When creating a Pod in this namespace, the API Server checks the MutatingWebhookConfiguration
- The API Server finds that the Pod creation operation matches the webhook rules and sends a request to the AWS Load Balancer Controller webhook service (using kube-dns to resolve the Cluster IP address corresponding to
aws-load-balancer-webhook-service.kube-system.svc) - After receiving the request, the webhook service checks the Pod specification and injects the required readinessGates configuration
- The API Server receives the modified Pod specification and saves it to etcd
From the above discussion, we can see that the Kubernetes Admission Webhook workflow is quite complex, involving communication and collaboration between multiple components. When users or systems initiate a request to create resources, the request needs to go through a series of checks and processing before it can finally be executed. Any problems in any part of this process may cause the entire workflow to be blocked, thereby affecting the normal operation of the cluster.
Common Webhook Failure Patterns
Based on real case analysis, I have summarized several common webhook failure patterns:
1. Network Connectivity Issues
Network connectivity issues are one of the most common webhook failures. When network communication within the cluster has problems, it may cause webhook services to fail to respond normally to API Server requests. For example, here’s a typical error message indicating that the API Server cannot find the webhook service:
error when patching "istio-gateway.yaml": Internal error occurred: failed calling webhook "validate.kyverno.svc-fail": failed to call webhook: Post "https://kyverno-svc.default.svc:443/validate/fail?timeout=10s": context deadline exceeded
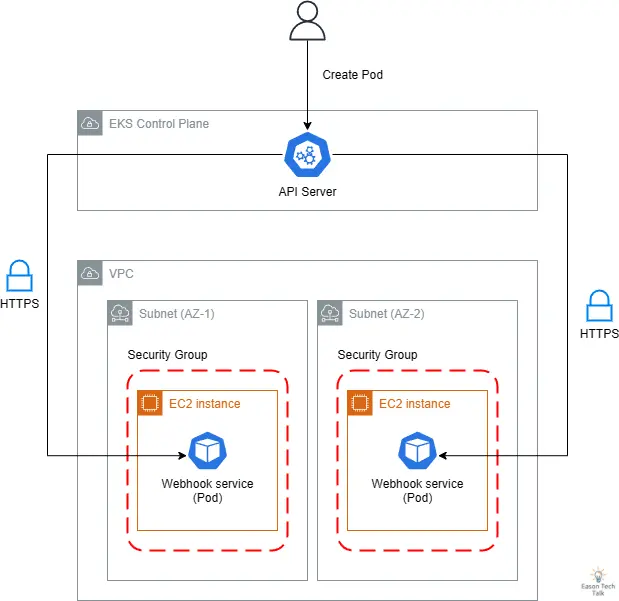
These issues may stem from DNS resolution failures, excessive network latency, CNI errors, or service discovery mechanism failures. Taking the Amazon EKS environment as an example, here’s a common webhook service data flow in a cloud-native environment, revealing how the API Server connects to webhook services through cloud infrastructure:
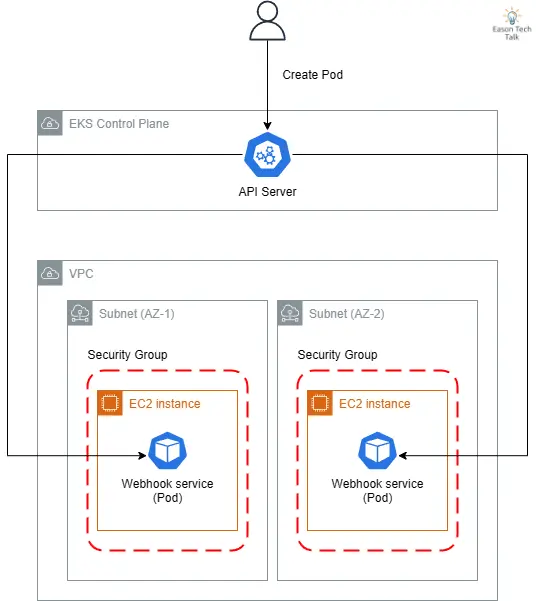
- The API Server is located in the AWS-managed EKS Control Plane, while webhook services run on EC2 instances in the customer VPC
- For high availability, webhook services are typically deployed in subnets across different availability zones (AZ-1, AZ-2)
- Security groups restrict network traffic to and from webhook services
Network connectivity issues that may occur in this architecture include: subnet routing errors, security group rule restrictions, DNS resolution failures (CoreDNS), system-level network issues (such as kube-proxy failing to correctly configure iptables or ipvs rules affecting target Pods), etc. Any problem in any link may cause webhook calls to fail, thereby affecting the normal operation of the entire cluster. These network paths are key points to check during failure diagnosis.
2. Certificate Expiration and TLS Issues
Certificate expiration and TLS issues are another common failure point. When webhook TLS certificates expire or are misconfigured, the API Server will be unable to establish secure connections with webhook services. This situation is particularly tricky because certificate expiration issues are often not discovered in time.
For example, in my experience helping customers, earlier versions of AWS Load Balancer Controller often encountered certificate expiration, causing new Ingress resources to fail creation.
Events:
Type     Reason             Age                From     Message
----     ------             ----               ----     -------
Warning  FailedDeployModel  53m (x9 over 63m)  ingress  (combined from similar events): Failed deploy model due to Internal error occurred: failed calling webhook "mtargetgroupbinding.elbv2.k8s.aws": Post "https://aws-load-balancer-webhook-service.kube-system.svc:443/mutate-elbv2-k8s-aws-v1beta1-targetgroupbinding?timeout=30s": x509: certificate has expired or is not yet valid: current time 2022-03-03T07:37:16Z is after 2022-02-26T11:24:26Z
To solve this problem, the latest version automatically generates self-signed certificates with a validity period of more than ten years through the built-in genCA method when installing with Helm.
If your cluster environment uses packages like Cert-manager to rotate TLS certificates, you need to pay special attention to whether the certificate update mechanism works normally and ensure sufficient processing time before certificate expiration, implementing automated certificate rotation mechanisms to reduce the need for manual intervention.
3. Latency and Performance Degradation (Control Plane)
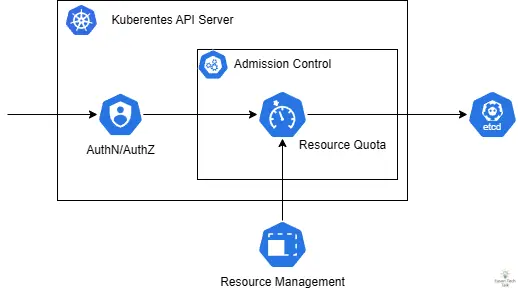
Control plane latency and performance degradation are another important source of failures. When Kubernetes Master Node services have excessively long response times or the services themselves have degraded processing capabilities, it may cause request timeouts. This situation usually occurs when large-scale loads are too high or underlying resources (such as CPU, memory) are insufficient, which may cause request accumulation and timeouts.
Taking the built-in ResourceQuota as an example, as part of the built-in Kubernetes Admission Controller, its workflow is very similar to webhooks. When users attempt to create or update resources, the API Server calls the ResourceQuota Admission Controller to check whether resource quota limits are violated. During this process, the API Server needs to calculate the current resource usage and compare it, and the corresponding resource limit status will be updated to etcd.
An interesting case is ResourceQuota failing to work correctly due to high load on the Kubernetes Controller Manager, commonly seen when there are too many Kubernetes resources or CPU processing speed is too slow. Since ResourceQuota is part of the default Validating Admission Plugin, when its monitoring logic has problems, it may affect the resource quota execution of the entire cluster. In this situation, the cluster may not correctly limit resource usage, leading to over-allocation or uneven resource distribution. Here’s a real case showing how ResourceQuota Controller affects cluster operation due to synchronization timeouts:
E0119 11:37:53.532226       1 shared_informer.go:243] unable to sync caches for garbage collector
E0119 11:37:53.532261       1 garbagecollector.go:228] timed out waiting for dependency graph builder sync during GC sync (attempt 73)

I0119 11:37:54.680276       1 request.go:645] Throttling request took 1.047002085s, request: GET:https://10.150.233.43:6443/apis/configuration.konghq.com/v1beta1?timeout=32s
I0119 11:37:54.831942       1 shared_informer.go:240] Waiting for caches to sync for garbage collector
I0119 11:38:04.722878       1 request.go:645] Throttling request took 1.860914441s, request: GET:https://10.150.233.43:6443/apis/acme.cert-manager.io/v1alpha2?timeout=32s
E0119 11:38:04.861576       1 shared_informer.go:243] unable to sync caches for resource quota
E0119 11:38:04.861687       1 resource_quota_controller.go:447] timed out waiting for quota monitor sync
In this example, we can see that when the API Server sends requests to the ResourceQuota controller, processing delays may occur due to high control plane load, causing the applied ResourceQuota updates to be inconsistent with etcd records, such as applying a new memory limit (52Gi) but being unable to synchronize the application in new resources (62Gi).
$ kubectl get quota webs-compute-resources -n webs -o yaml
spec:
  hard:
    pods: "18"
    limits.cpu: "26"
    limits.memory: "52Gi"
status: {}

$ kubectl describe namespace webs
Name:         webs
Labels:       team=webs
              webs.tree.hnc.x-k8s.io/depth=0
Annotations:  <none>
Status:       Active

Resource Quotas
 Name:     webs-compute-resources
 Resource  Used  Hard
 --------  ---   ---

Resource Limits
 Type       Resource  Min   Max   Default Request  Default Limit  Max Limit/Request Ratio
 ----       --------  ---   ---   ---------------  -------------  -----------------------
 Container  cpu       50m   2     150m             500m           -
 Container  memory    16Mi  18Gi  32Mi             64Mi           -
Newly created Pod events still reference the old memory limit (62Gi), but subsequent updates show the limit has been reduced to 52Gi, yet system behavior still references the old limit value. This inconsistency may cause resource configuration confusion and even hinder new Pod creation. In high-load environments, synchronization delays between control plane components become more severe.
creating: pods "workspace-7cc88789c5-fmcxm" is forbidden: exceeded quota: compute-resources, requested: limits.memory=10Gi, used: limits.memory=60544Mi, limited: limits.memory=62Gi
4. Resource Limitations and Scalability Issues (Data Plane)
When webhook service resource configurations are insufficient or cannot effectively scale horizontally, it may cause service instability. For example, if webhook Pod memory limits are set too low, it may cause OOM (Out of Memory) errors; or if HPA (Horizontal Pod Autoscaling) is not configured correctly, it may not scale in time to handle increased request volume during high loads.
apiVersion: v1
kind: Pod
metadata:
  name: memory-demo
  namespace: pod-resources-example
spec:
  resources:
    requests:
      memory: "100Mi"
    limits:
      memory: "200Mi"
  containers:
  - name: memory-demo-ctr
    image: nginx
    command: ["stress"]
    args: ["--vm", "1", "--vm-bytes", "150M", "--vm-hang", "1"]
Cascading Failure Cases
Cascading failures refer to situations where problems with one core component’s webhook can trigger a series of systemic failures. Here are several real cases:
System Resource Exhaustion Failure Case
In a real case, webhook service errors occurred due to insufficient node resources. The core problem was memory shortage on nodes plus disk space approaching full capacity, triggering eviction events:
$ kubectl get pods -n kube-system
NAME                 READY   STATUS      RESTARTS   AGE
example-pod-1234     0/1     Evicted     0          5m
example-pod-5678     0/1     Evicted     0          10m
example-pod-9012     0/1     Evicted     0          7m
example-pod-3456     0/1     Evicted     1          15m
example-pod-7890     0/1     Evicted     0          3m
This ultimately prevented new Pods from being created, causing entire service unavailability.
$ kubectl get events -n curl
...
23m Normal   SuccessfulCreate replicaset/curl-9454cc476   Created pod: curl-9454cc476-khp45
22m Warning  FailedCreate     replicaset/curl-9454cc476   Error creating: Internal error occurred: failed calling webhook "namespace.sidecar-injector.istio.io": failed to call webhook: Post "https://istiod.istio-system.svc:443/inject?timeout=10s": dial tcp 10.96.44.51:443: connect: connection refused
Node-pressure Eviction occurs when nodes face resource pressure (such as memory shortage, disk space shortage, or disk I/O pressure). Kubelet monitors these resources based on default or custom thresholds, and when thresholds are exceeded, nodes are marked as under pressure and begin evicting Pods to free resources. In this situation, lower-priority Pods are evicted first until node resource pressure drops to safe levels. However, if the eviction process fails to stop in time, it may cascade to affect critical webhook service Pods, causing them to be evicted as well. When webhook services become unavailable, the API Server cannot complete any resource operations associated with that webhook, thereby limiting the entire cluster’s functionality. In high-pressure environments, this cascading reaction may spread rapidly, evolving from single node issues to cluster-wide service interruptions.
Kubernetes Controller Manager Blocking Failure Case
In this case, the Controller Manager fell into a retry loop due to inability to establish connections with webhook services, causing system performance degradation. From the logs, we can see that the controller encountered webhook call failures when attempting to synchronize jobs:
I0623 12:15:42.123456       1 job_controller.go:256] Syncing Job default/example-job
E0623 12:15:42.124789       1 job_controller.go:276] Error syncing Job "default/example-job": Internal error occurred: failed calling webhook "validate.jobs.example.com": Post "https://webhook-service.default.svc:443/validate?timeout=10s": dial tcp 10.96.0.42:443: connect: connection refused
W0623 12:15:42.125000       1 controller.go:285] Retrying webhook request after failure
E0623 12:15:52.130123       1 job_controller.go:276] Error syncing Job "default/example-job": Internal error occurred: failed calling webhook "validate.jobs.example.com": Post "https://webhook-service.default.svc:443/validate?timeout=10s": dial tcp 10.96.0.42:443: connect: connection refused
W0623 12:15:52.130456       1 controller.go:285] Retrying webhook request after failure
In this case, what was originally just a single webhook failure preventing Pod creation escalated because a large number of Kubernetes Jobs were also deployed, and these Kubernetes Jobs would be continuously recreated, with each Job creation triggering webhook calls.
When webhook services are unavailable, the Job Controller enters a retry loop. The Job Controller is also part of the Kubernetes Controller Manager, and the Kubernetes Controller Manager itself is designed as an infinite loop, continuously running other controllers. As the number of Jobs increases, the Job Controller’s resource consumption (CPU) rises sharply because the loop spends most of its time processing Job Controller work, thereby affecting the normal operation of other Kubernetes Controller Manager core functions.
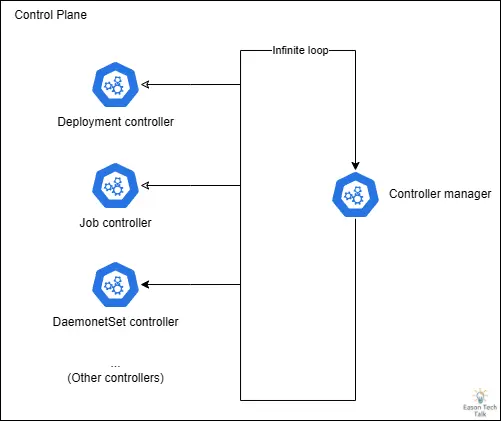
This situation is particularly serious because when the Kubernetes Controller Manager’s processing capacity is occupied by a large number of Job Controller-triggered webhook retry requests, it cannot effectively execute other critical controllers such as Deployment, StatefulSet, or DaemonSet.
When the Kubernetes Controller Manager repeatedly attempts to communicate with unavailable webhook services, the control loop becomes blocked. As retry attempts increase, more and more requests accumulate, and this blocking effect spreads rapidly, especially when involving core components (such as CNI plugin-dependent DaemonSet Controller). CNI cannot deploy correctly, which may prevent newly scaled nodes from initializing correctly (remaining in NotReady state), and even with sufficient hardware resources, services cannot be restored.
Calico + Kyverno Case
When critical components (such as CNI) have dependencies with webhook services, special attention must be paid to the impact of webhook failures on cluster availability, otherwise a simple webhook failure may cause more serious cascading effects.
In the audit log provided by this case, it shows that mutual blocking between Calico network components and Kyverno policy engine caused serious cluster availability issues. When Calico needed to update service configurations, Kyverno’s webhook could not respond normally because it had no available endpoints. This deadlock state prevented critical network components from updating, ultimately causing the entire cluster’s network functionality to be damaged or completely fail.
{
    "kind": "Event",
    "apiVersion": "audit.k8s.io/v1",
    "level": "RequestResponse",
    "stage": "ResponseComplete",
    "requestURI": "/api/v1/namespaces/calico-system/services/calico-typha",
    "verb": "update",
    "responseStatus": {
        "metadata": {},
        "status": "Failure",
        "message": "Internal error occurred: failed calling webhook \"validate.kyverno.svc-fail\": failed to call webhook: Post \"https://kyverno-svc.kyverno.svc:443/validate/fail?timeout=10s\": no endpoints available for service \"kyverno-svc\"",
        "reason": "InternalError",
        "details": {
            "causes": [{
                "message": "failed calling webhook \"validate.kyverno.svc-fail\": failed to call webhook: Post \"https://kyverno-svc.kyverno.svc:443/validate/fail?timeout=10s\": no endpoints available for service \"kyverno-svc\""
            }]
        },
        "code": 500
    },
}
This error may mildly affect NetworkPolicy functionality, at most affecting some Pod network communication. However, more seriously, it may cause complete cluster network failure. When Calico network components cannot update or reconfigure, the entire cluster’s network functionality may be paralyzed, completely interrupting inter-node communication, and new nodes cannot join the cluster.
Monitoring and Detection Strategies
After exploring some webhook failure patterns and understanding the potential impacts of webhook failures, let’s continue discussing some error detection and monitoring strategies that can be considered for implementation.
1. Key Metrics Monitoring
Kubernetes provides many built-in key metrics in Prometheus format by default 2. Metrics related to Admission Webhooks typically include the following:
webhook_rejection_count: Tracks the number of rejected webhook requests; abnormal increases may indicate configuration issues or service instability.webhook_request_total: Records total request count, helping understand traffic trends and identify potential anomaly patterns.webhook_fail_open_count: Records requests that automatically pass due to failures, especially important for webhooks with failurePolicy: Ignore.
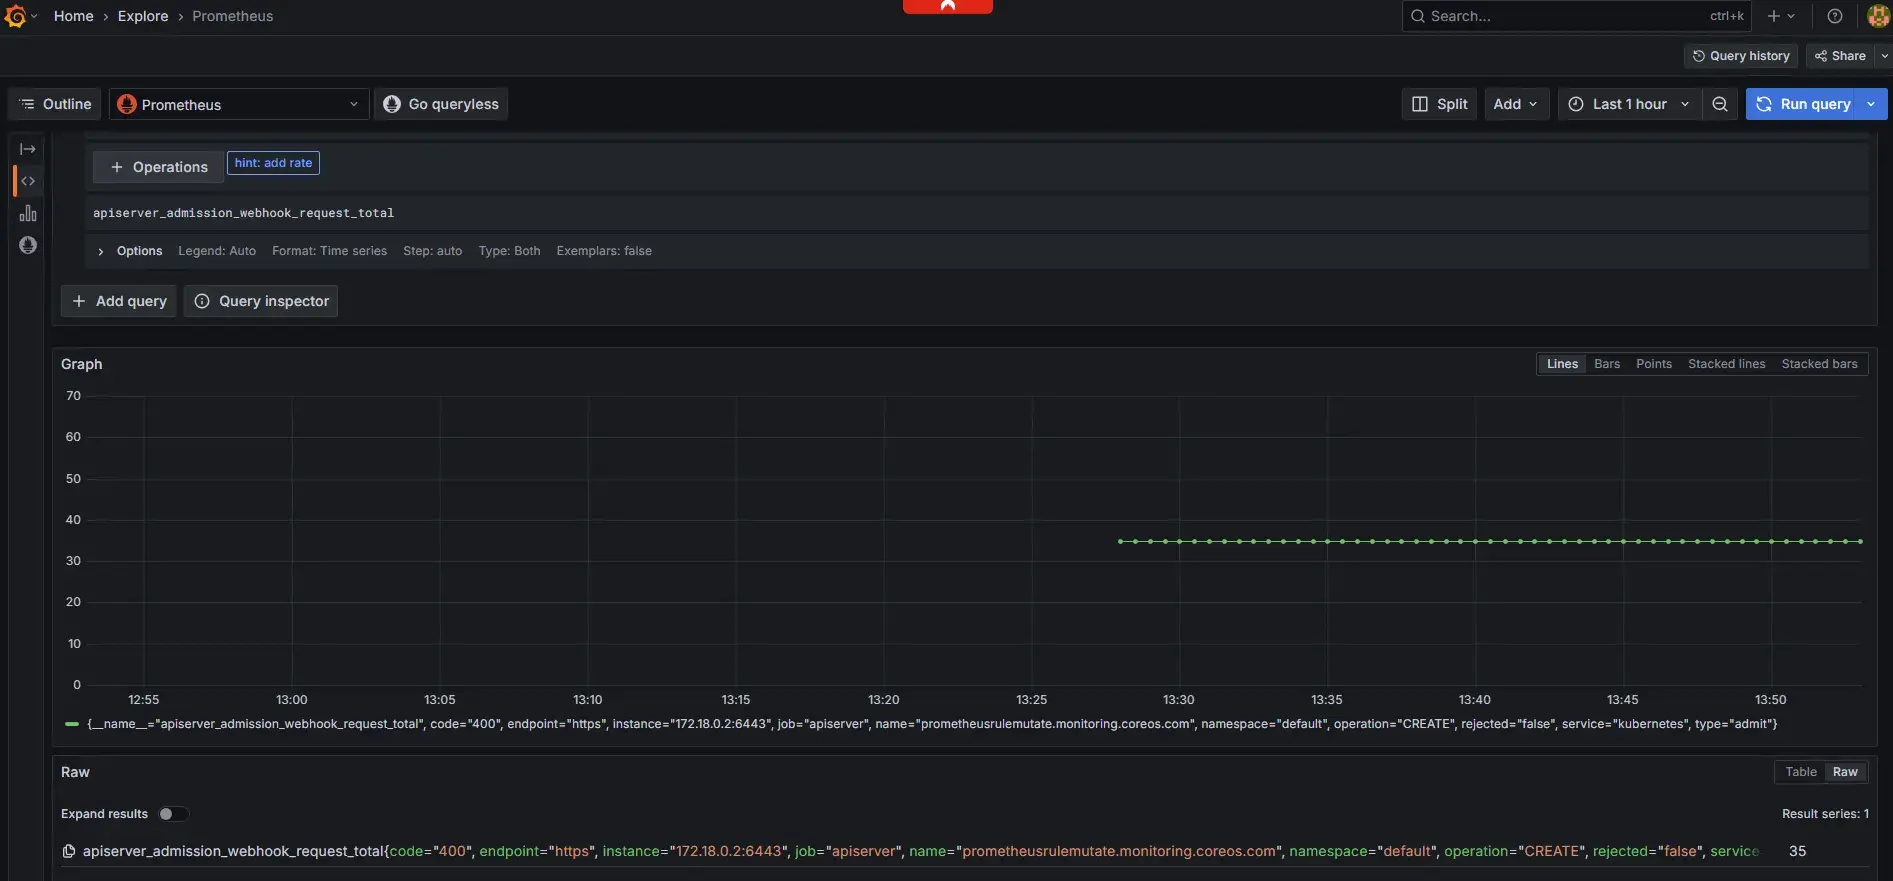
These metrics can be collected by accessing the /metrics path, commonly through Prometheus, Datadog, or other monitoring systems that support Prometheus format for collection and analysis. Here’s an example of checking API Server-related metrics through kubectl commands:
$ kubectl get --raw /metrics | grep "apiserver_admission_webhook"
apiserver_admission_webhook_request_total{code="400",name="mpod.elbv2.k8s.aws",operation="CREATE",rejected="true",type="admit"} 17

$ kubectl get --raw /metrics | grep "apiserver_admission_webhook_rejection"
apiserver_admission_webhook_rejection_count{error_type="calling_webhook_error",name="mpod.elbv2.k8s.aws",operation="CREATE",rejection_code="400",type="admit"} 17
Some open-source community integration solutions include the kube-prometheus-stack package, which can be quickly installed through Helm tools, providing a complete Prometheus and Grafana monitoring solution, including default API Server and webhook-related metric dashboards. This integrated solution not only helps us monitor webhook operational status but also provides early warnings before potential issues occur.
Additionally, for critical applications and services, you can check whether corresponding Prometheus or monitoring application availability metrics are provided, establish specific monitoring metrics and alert thresholds. Also monitor related resource usage, such as CPU, memory utilization, and network latency metrics.
2. Log Analysis
In addition to API server metrics, you can also proactively filter and discover possible call failure errors through log analysis. When encountering webhook-related issues, analyzing API server logs can provide valuable clues. From the API Server’s webhook triggering operations, we can gain insights. Kubernetes has dispatcher.go subroutines for triggering operations in both Mutating and Validating phases. In the current version (Kubernetes v1.33), both use failed to call webhook as error message output 3 4:
if err != nil {
  var status *apierrors.StatusError
  if se, ok := err.(*apierrors.StatusError); ok {
    status = se
  } else {
    status = apierrors.NewServiceUnavailable("error calling webhook")
  }
  return &webhookutil.ErrCallingWebhook{WebhookName: h.Name, Reason: fmt.Errorf("failed to call webhook: %w", err), Status: status}
}
Therefore, we can use the above output as keywords. When webhook failures occur, the API Server typically logs detailed error information, including connection timeouts, TLS errors, or service unavailability issues. Configure centralized log collection and analysis systems in cloud-native environments.
Here’s an example query for filtering API Server logs in AWS CloudWatch Log Insights. This simple query example filters all kube-apiserver logs containing failed to call webhook 5:
fields @timestamp, @message, @logStream
| filter @logStream like /kube-apiserver/
| filter @message like 'failed to call webhook'
Here’s an example using CloudWatch to convert filtered results into metrics for monitoring or alerting 5:
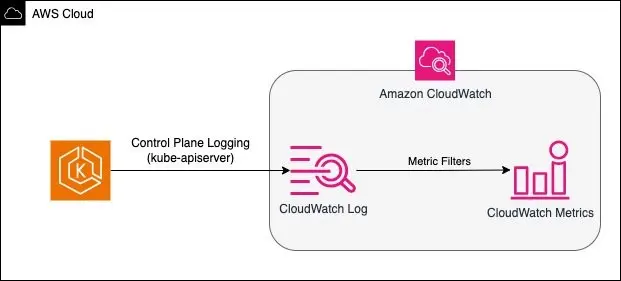
For self-managed or on-premises Kubernetes cluster environments, you can similarly continuously filter these API Server logs and integrate automated alerting mechanisms to send real-time notifications when these errors are captured.
3. Health Status Monitoring
Regular health status checks of webhook services are the first line of defense against issues:
- Set up basic Liveness Probe and Readiness Probe
- Monitor service response times and error rates
- Track webhook service resource usage (CPU, memory, etc.)
Best Practices
In this section, we’ll explore best practices for preventing and responding to Kubernetes webhook failures. These recommendations come from real production environment experience and aim to help you build more robust Kubernetes environments. Here are best practice recommendations for several key areas:
1. Resource Configuration Optimization
- Set appropriate resource requests and limits for webhook services
- Run multiple replicas for critical webhook services and implement Horizontal Pod Autoscaling (HPA) to handle load variations
- Use Pod Disruption Budget to ensure service availability
2. Security Considerations
- Regularly rotate TLS certificates, especially when using self-signed certificates
- When using cert-manager to implement automated certificate management, pay close attention to certificate validity periods and update status
3. Other Optimization Considerations
- Run custom webhook services in dedicated namespaces to avoid affecting all namespaces during failures (e.g., correctly use namespaceSelector and objectSelector to avoid affecting all resources during failures, or even causing deadlocks)
- For Kubernetes v1.30 and later versions, consider using ValidatingAdmissionPolicy to replace traditional validating webhooks, reducing external application dependencies to improve system stability
Here’s a simple ValidatingAdmissionPolicy example that describes when creating or updating Deployments, the replica count should be less than or equal to five.
This type of resource can complete mechanisms you originally relied on external webhook services at the Kubernetes Control Plane level, without needing to call external webhooks, thereby reducing risks caused by external factors that prevent webhook calls.
apiVersion: admissionregistration.k8s.io/v1
kind: ValidatingAdmissionPolicy
metadata:
  name: "demo-policy.example.com"
spec:
  failurePolicy: Fail
  matchConstraints:
    resourceRules:
    - apiGroups:   ["apps"]
      apiVersions: ["v1"]
      operations:  ["CREATE", "UPDATE"]
      resources:   ["deployments"]
  validations:
    - expression: "object.spec.replicas <= 5"
---
apiVersion: admissionregistration.k8s.io/v1
kind: ValidatingAdmissionPolicyBinding
metadata:
  name: "demo-binding-test.example.com"
spec:
  policyName: "demo-policy.example.com"
  validationActions: [Deny]
  matchResources:
    namespaceSelector:
      matchLabels:
        environment: test
📝 Note: MutatingAdmissionPolicy is similar to ValidatingAdmissionPolicy but provides the ability to modify resources. It’s currently in Alpha stage in Kubernetes v1.32. This feature will enable developers to define resource modification rules directly in the Kubernetes API without deploying and maintaining external webhook services, further reducing system failure points. For detailed information, see KEP-39626.
Conclusion
Kubernetes Admission Webhooks provide powerful extension capabilities but also introduce potential risk points. By understanding common failure patterns, implementing effective monitoring strategies, and adopting best practices, we can significantly improve system stability and reliability.
This article has provided a detailed introduction to Kubernetes webhook failure management, from basic concepts to diagnostic methods, to monitoring strategies and best practices. We’ve seen how to identify common failure patterns and how to prevent issues through metrics monitoring and log analysis. Particularly noteworthy is that with Kubernetes evolution, new features like ValidatingAdmissionPolicy are reducing dependence on external webhooks, thereby improving system stability.
I hope this article provides valuable insights and practical tools to help you more effectively manage webhook services in Kubernetes environments.
📧 Subscribe to EasonTechTalk: Get Technical Insights and Practical Sharing
If you’re interested in learning about cloud technologies and related trends, welcome to subscribe to the EasonTechTalk newsletter for updates. Let’s continue improving together on the technical journey!
References